The purpose of this article is to demonstrate some useful troubleshooting tools.
Initial checklist
<>
In SiteManager, check:
- Agent
- JSON config
- Certificates
- NTP
- DCM Status
- Log view
- Status extended
In GateManager, check:
- LMM user
In the SiteManager, there are various different tools to help you troubleshoot the DCM setup.
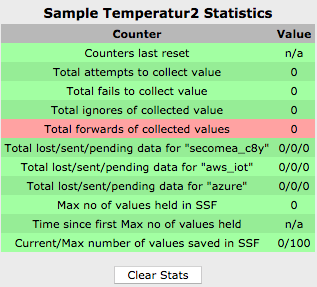
The "DCM > Status " page is a great overview tool for viewing the overall health of your setup.
"DCM > Status > Details" page contains further details for troubleshooting.
"Log > View" is useful for tracking errors and the reason.
"GateManager > agents" can tell you whether the DCM config and agents config match.
Status page (DCM > Status > Details)
The Details page consists of an overview on the right. Here, you can click to go to the corresponding section.
In the center, you will see various sections, the first 3 of which are a general configuration overview.
Subsystem configuration
Edge ID: The device ID you enter in the IoT clouds to identify the specific device.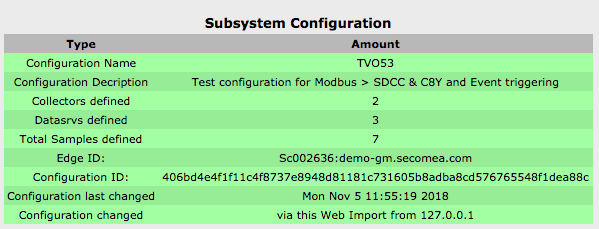
Store&forward database statistics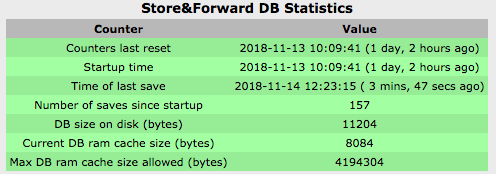
Alarms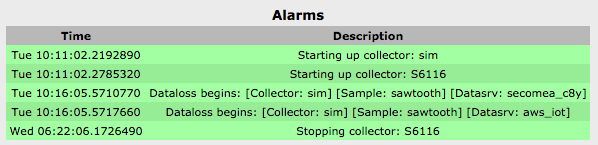
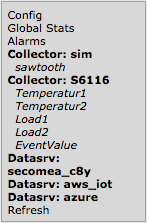
Collectors and sample-points
The first part is all about the Collector(s)
The first part is a general overview of the collector
(Here, an overview is shown from a collector named "sim". "sim" is also the value mentioned in the agent parameter details.)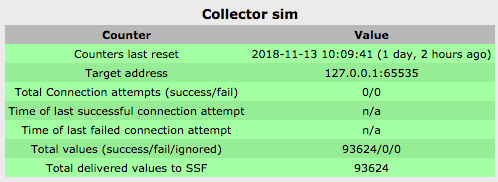
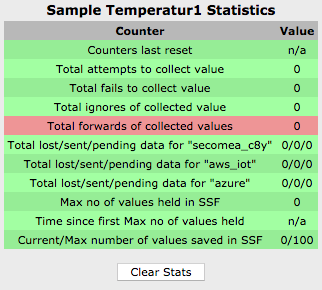
Then, one section per sample point, configured for the collector.
(Here, it shows that data is not reaching 2 of the 3 clouds configured,
also evident in the Alarms section)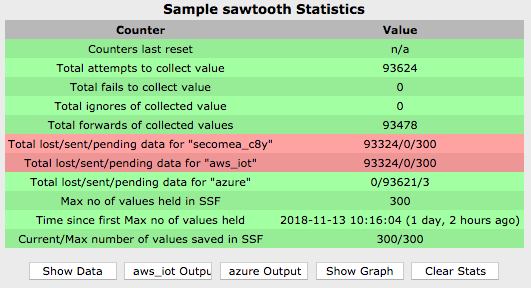
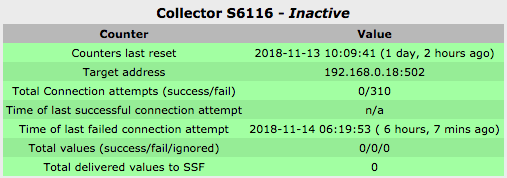
Another example of a Collector and sample-points with errors.
Notice the "Inactive" status next to the heading.
Data servers
First, a data server in an error state, notice the (Inactive) status and the zeros.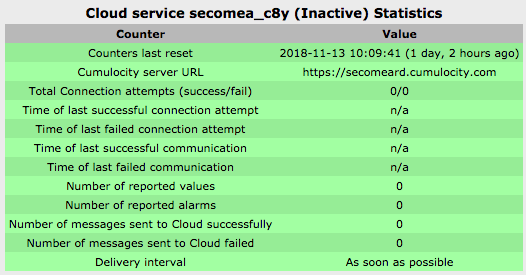
Another data server in error state/ notice the 399 connection fails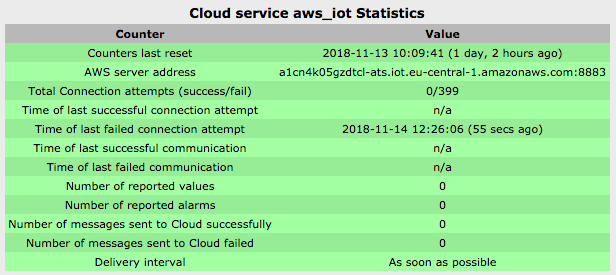
And finally, a working data server, however, note that 2 messages haven't reached the cloud.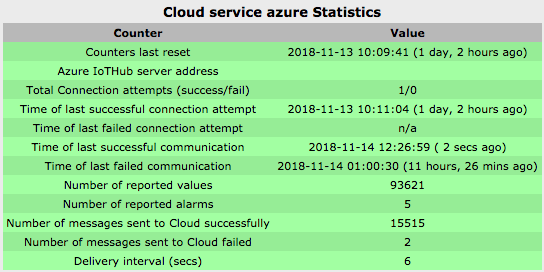
Log page (Log > View)
DCM Log entry examples
Nov 14 06:18:51 (none) user.info datasrv_aws[1094]: datasrv_aws: sawtooth: Error(-4) connecting to a1cn4k05gzdtcl-ats.iot.eu-central-1.amazonaws.com:8883 as Sc002636:demo-gm.secomea.com - will try again in 237 secs
Nov 14 06:19:53 (none) user.err collector_modbus[1097]: collector_modbus: S6116: Cannot modbus connect: Operation now in progress
Nov 14 06:22:06 (none) cron.debug ACM[1040]: Stop DCM agent 0x300040: "192.168.0.18 dcmcn=S6116 dcmpn=502"
Nov 14 06:22:06 (none) user.err ssfd[1059]: ssfd: New Alarm: Stopping collector: S6116
Nov 14 06:22:07 (none) user.info ssfd[1059]: ssfd: aws_iot: Process 1097 was killed with signal 9
Nov 14 06:22:07 (none) user.err ssfd[1059]: ssfd: aws_iot: Collector "S6116" died
More details are shown in log if debug is enabled. (Log > Setup > "Enable debug"=yes)