DCC Release Notes 1.7
- 26 May 2021
- 5 Minutes to read
- Contributors

- Print
- DarkLight
- PDF
DCC Release Notes 1.7
- Updated on 26 May 2021
- 5 Minutes to read
- Contributors
- Print
- DarkLight
- PDF
Article summary
Did you find this summary helpful?
Thank you for your feedback
New with Release 1.7
Secomea is pleased to introduce the new Data Collection Cloud 1.7 DCC. The release includes new features and several performance improvements.
Learn more about the new features below, and see the release notes for more information about other improvements and fixes.
Feature highlights
- It is now possible to define corporate subunits to differentiate account access. It is now possible for a company to define daughter companies or regional offices as “subunits” that have access to data for SiteManager/DCMs specific to them. The admins for the main account still have access to all units. This makes it possible to maintain trust zones within a single DCC account. One does this by creating the access account (aka LinkManager Mobile account) on the GateManager in a subdomain in which the allowed SiteManagers/DCMs are located, and applying this access account in DCC to represent the Subunit.
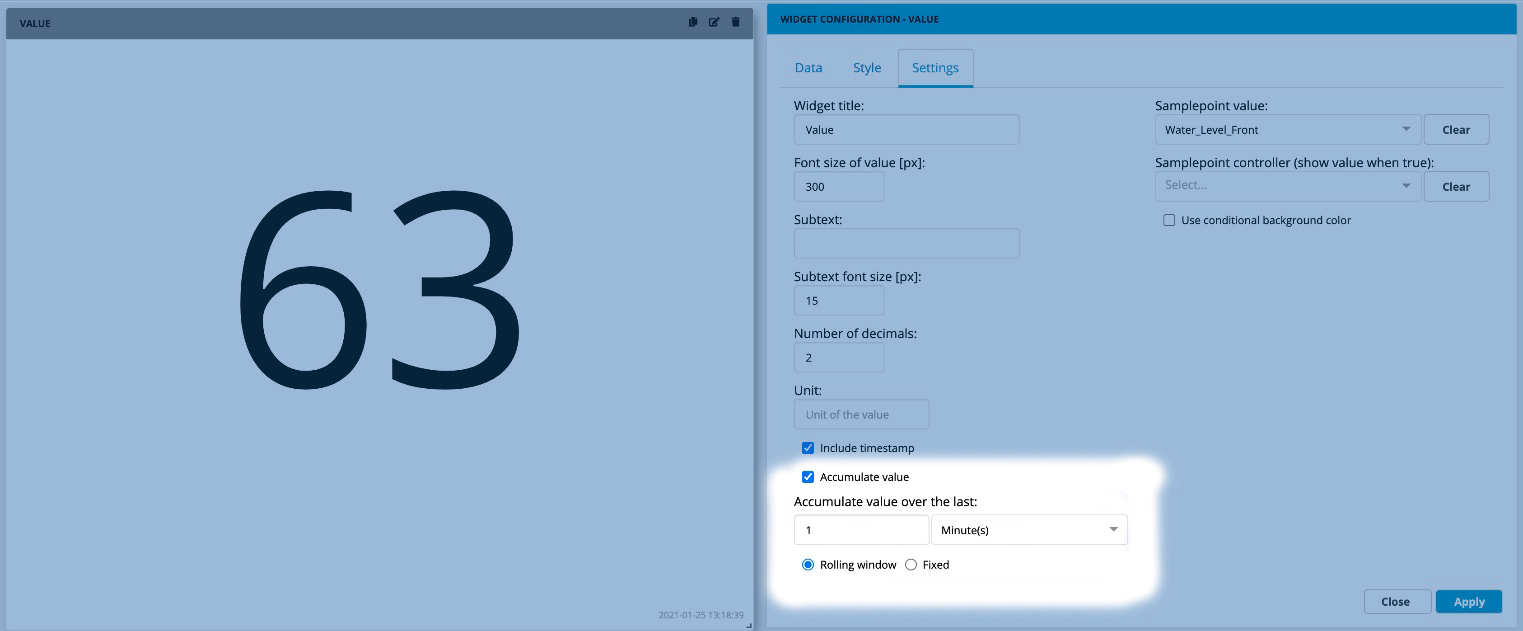
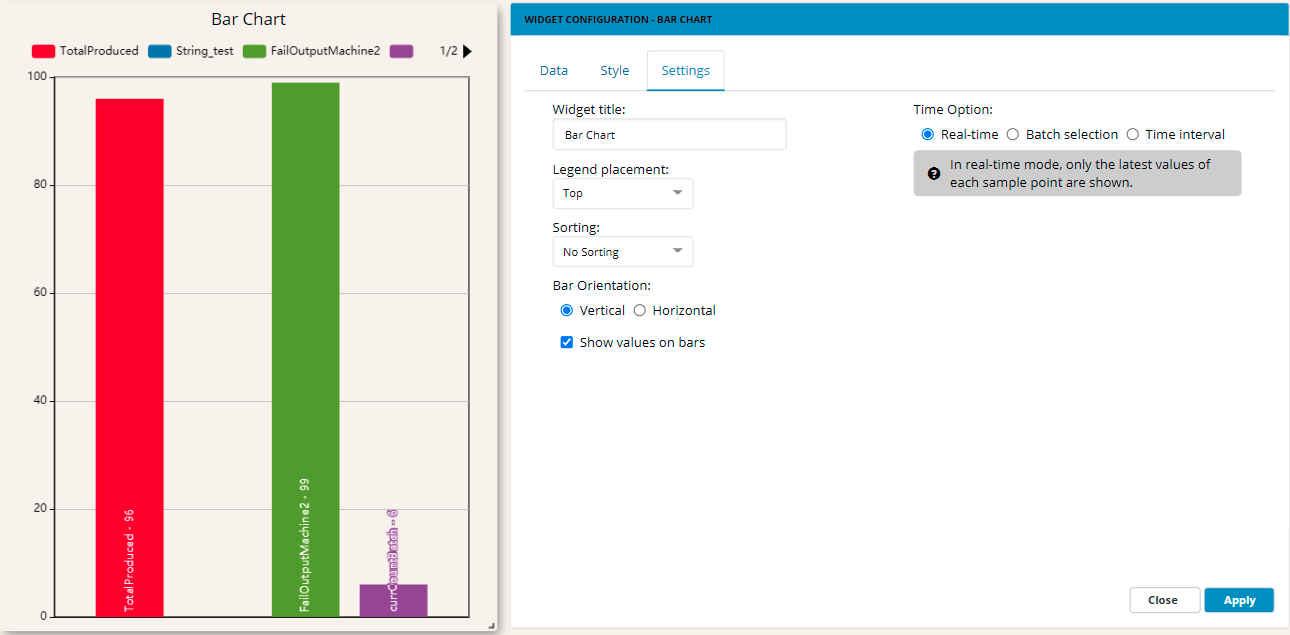
- The New Bar Chart widget provides greater visibility. You can now define a bar chart to present your data, in addition to the existing gauges and line charts. For certain types of data, such as “total units produced”, this provides greater visibility, and it can be further combined with a new feature for accumulating values over a given time period. For example you can collect and display all units produced for the last 24 hours, based on values collected from a PLC that is itself unrelated to time periods.
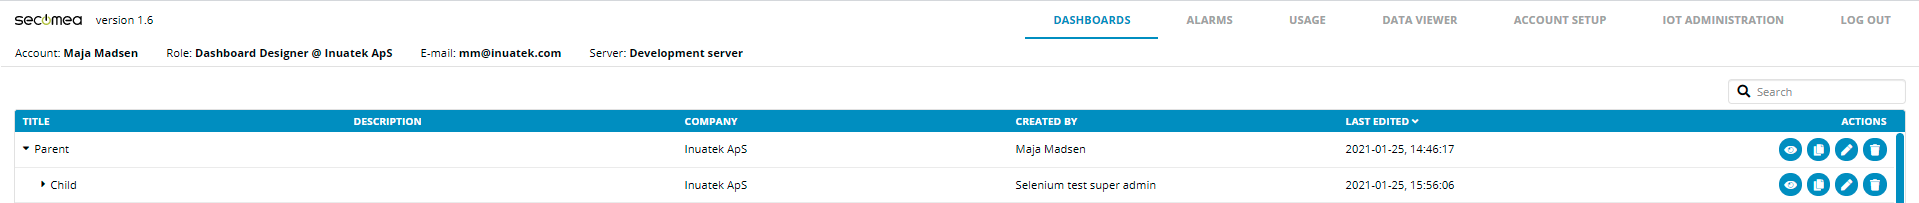
- Parent/Child dashboards provide a clear overview of dashboard structure. The feature for linking dashboards, introduced last year, has become increasingly popular. But in the Dashboard view, it can be difficult to identify the main dashboard (e.g., the factory overview) and its underlying dashboards (e.g., individual machine components). Now, you can structure your dashboards by defining parent-child relationships, which produces a clear overview of your dashboard structure.
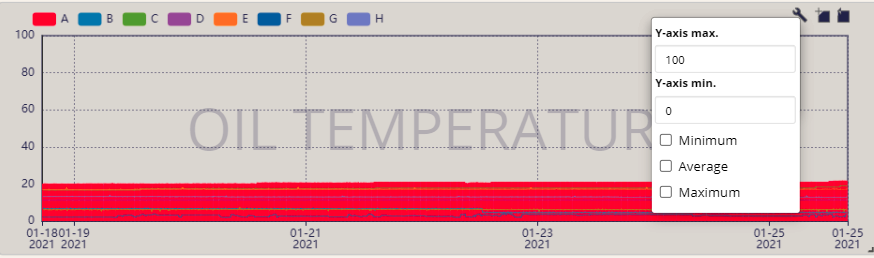
- Line chart improvements. The Line Chart widget is one of the most commonly used widgets, and has been enhanced with several visibility improvements. Along with new formatting controls, you can now customise margins and the y-axis min/max to clearly emphasize important data variations. You can now also define the graph title to appear as a “watermark”, to clearly identify what the graph is showing, such as “Oil Pressure” or ”Water level”.
- Stay tuned for a new Fleet Management Module. You will also notice some other new features, such as the “Logistics Template” feature. This feature is the first step toward a new Fleet Management Module currently in development for the next DCC release, and which is already in operation in live pilot projects. The Logistics Template allows you to build dashboard design templates that are automatically applied to new machines equipped with a SiteManager/DCM. A machine could be (e.g.) a vehicle and new vehicles will automatically be added to your list of vehicles in your dashboard selection list, or even to a geographic map view where you can monitor the vehicle's position and click on it to open the detailed dashboard.
Full release notes
Features
Data viewer
- Add custom YAxis configuration
- Added the option of customising the min/max values of the y-axis on the Data Viewer page:
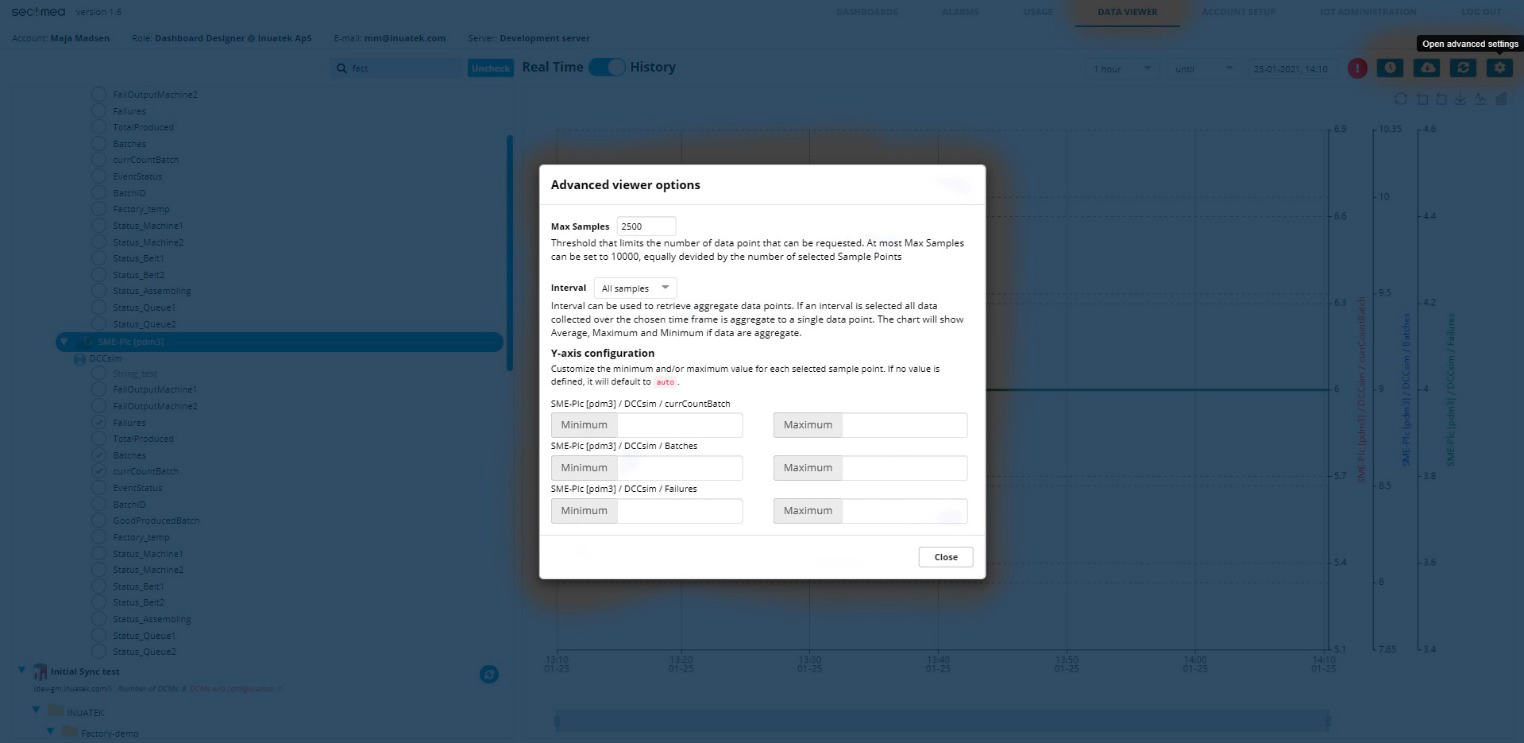
- Added the option of customising the min/max values of the y-axis on the Data Viewer page:

Account Setup
- New subunit
- Ability to create subunits. These subunits should be seen as different departments and a new level of user management has been introduced.
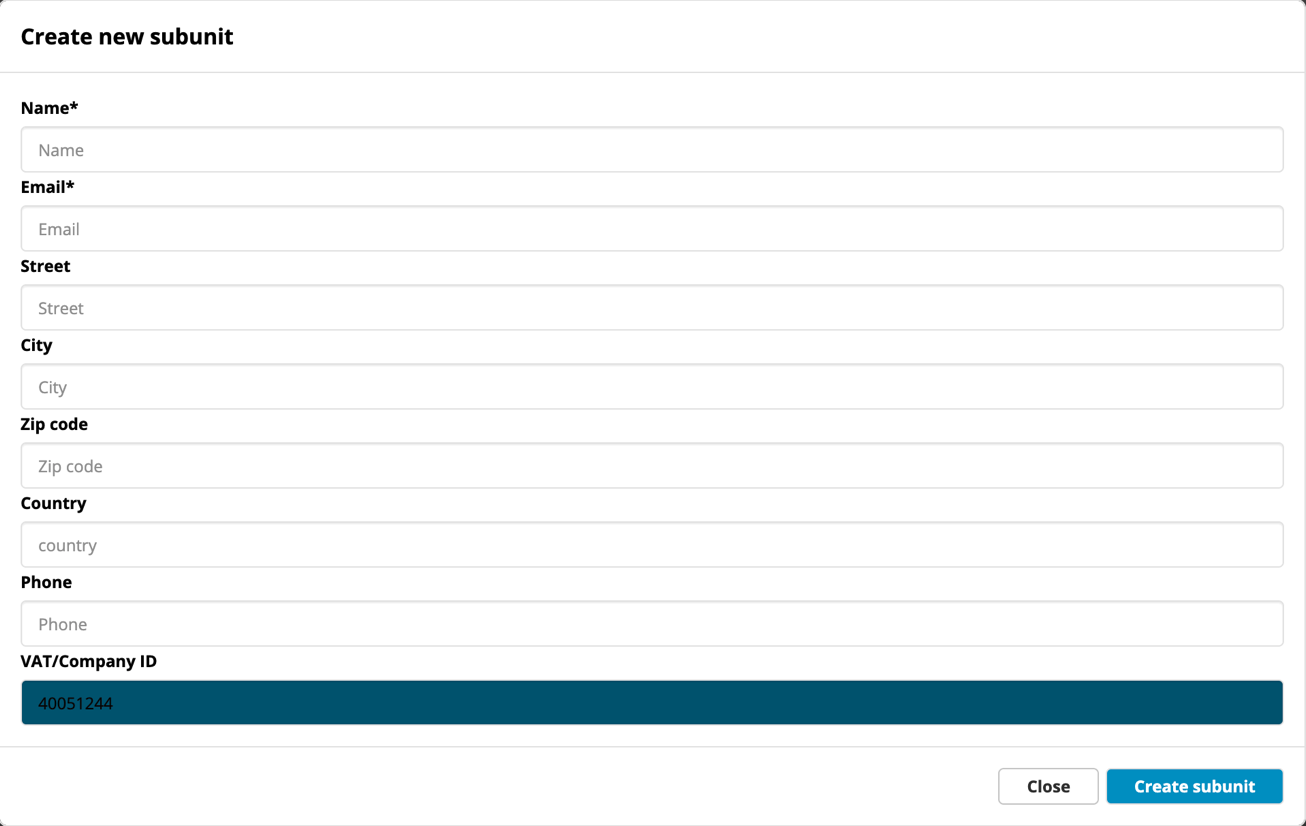
- Ability to create subunits. These subunits should be seen as different departments and a new level of user management has been introduced.
- Distributor access
- It is now possible to allow distributors to view/create domains and users for an end customer.
- Logistics template.
- It is now possible to create templates that can be used for logistics:
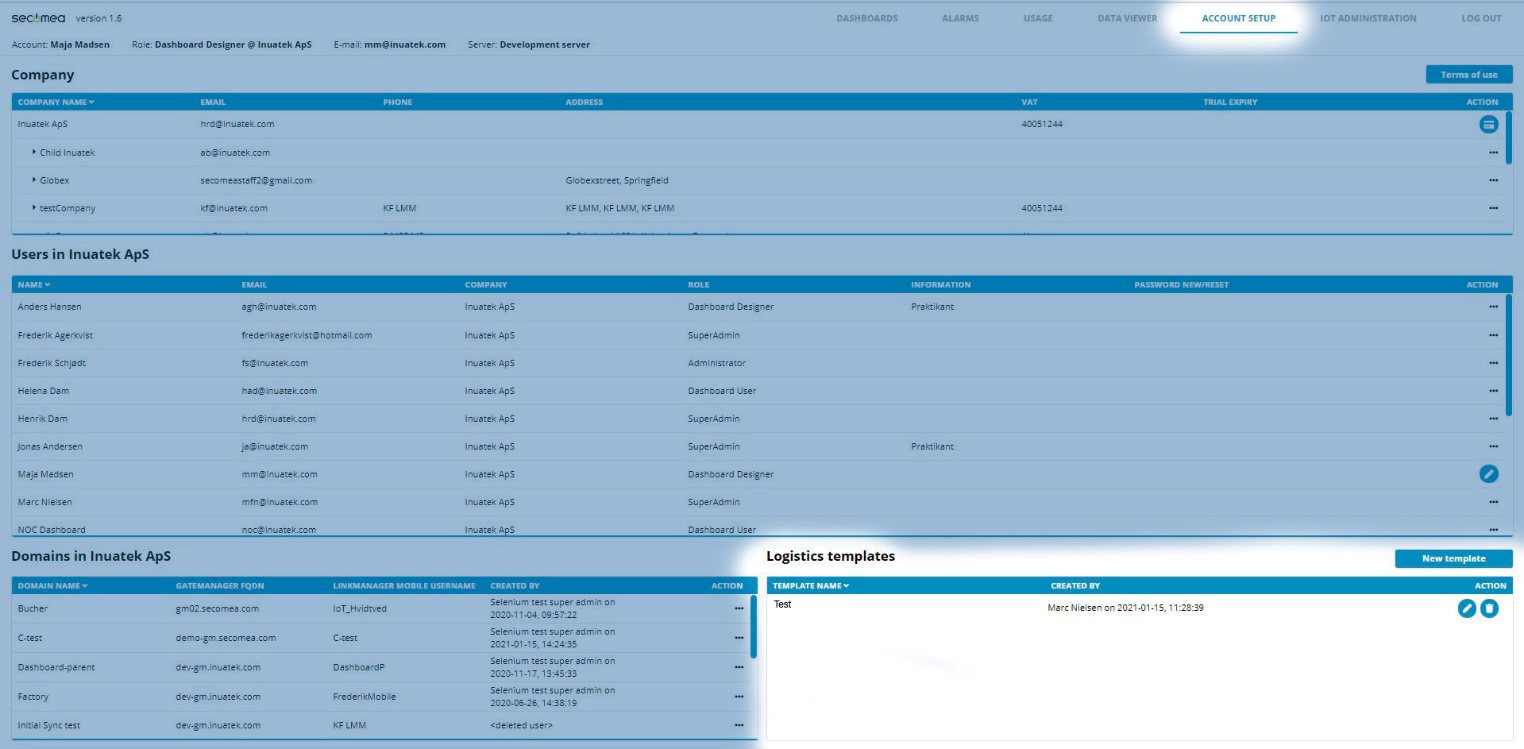
- It is now possible to create templates that can be used for logistics:


IoT Administration
- Logistics module.
- A new window (Logistics) under IoT ADMINISTRATION makes it possible to enter user-defined data, as well as data from sample points:
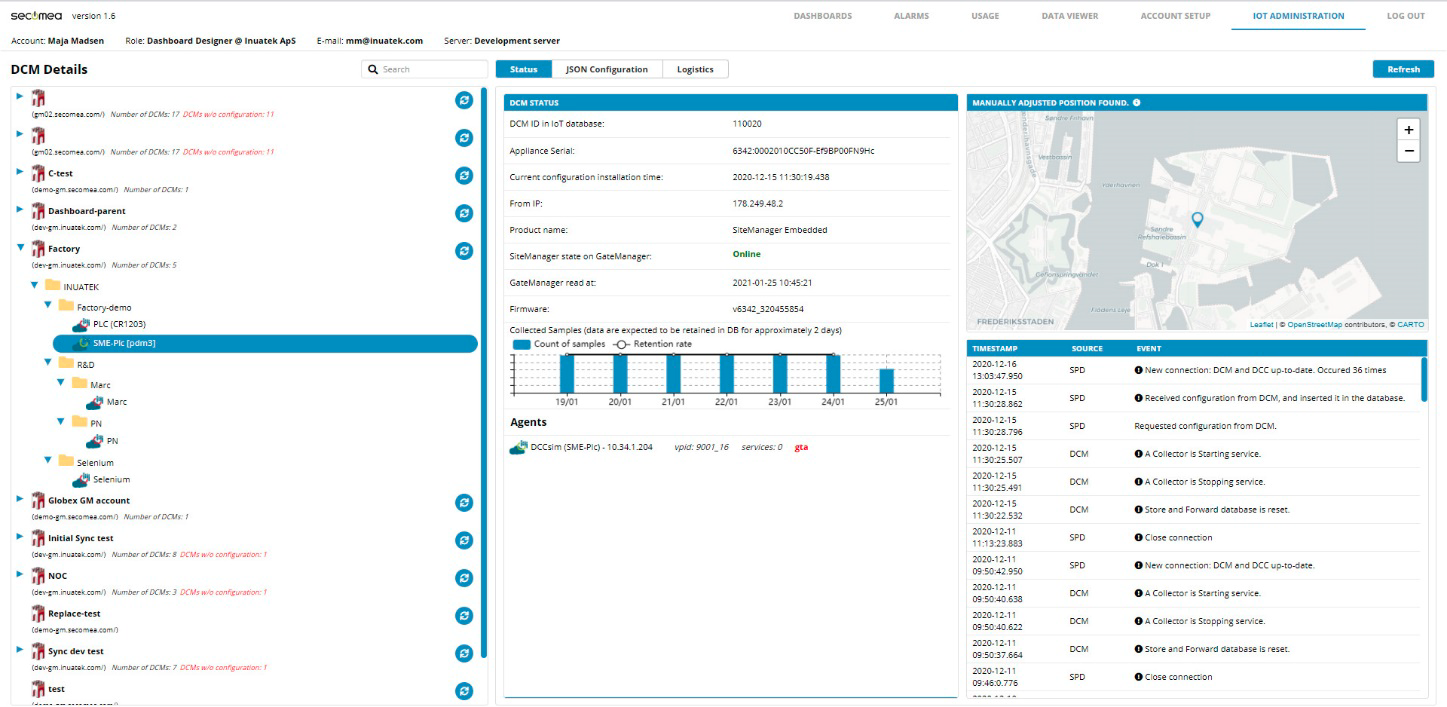
- A new window (Logistics) under IoT ADMINISTRATION makes it possible to enter user-defined data, as well as data from sample points:

Dashboard Overview
- Parent-child relationship`
- Introduced: the option of having dashboard parents/children
- Add parent under Dashboard setup
- There is now an option of expanding or collapsing the children of parent dashboards

Dashboard widgets
- Accumulated values.
- The value widget can be used for accumulated values over a fixed or rolling window.
- The value widget can be used for accumulated values over a fixed or rolling window.
- Added custom y-axis configuration for line charts
- Added: min/max y-axis options to real-time chart on dashboards
- Added: min/max y-axis options to time series chart on dashboards
- Changed: "Show min/avg/max" to "Options" after introducing YAxis min./max
- Bar chart
- A bar chart can be used to display values from sample points. There is an option for selecting multiple sample points. It is possible to use this feature for (among other things) accumulated values over a rolling window.
- A bar chart can be used to display values from sample points. There is an option for selecting multiple sample points. It is possible to use this feature for (among other things) accumulated values over a rolling window.
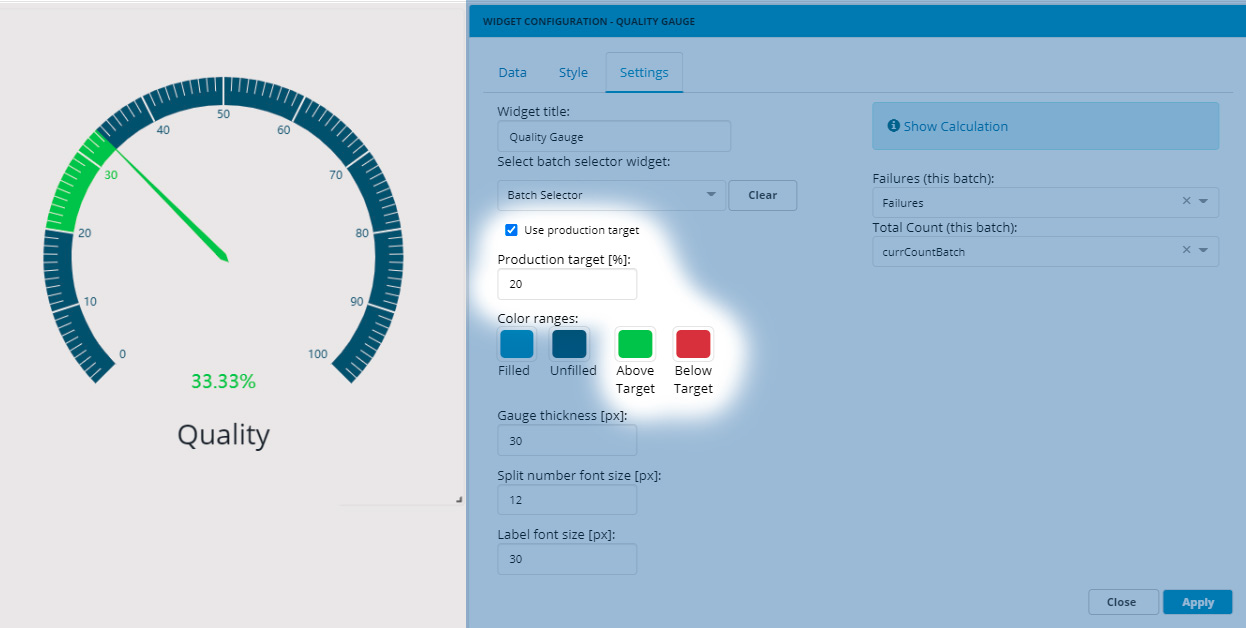
- Oee gauge real-time targets.
- A target area for OEE gauges has been introduced. The default value is "disabled", for legacy compatibility purposes. The default target value is 90%.
- A target area for OEE gauges has been introduced. The default value is "disabled", for legacy compatibility purposes. The default target value is 90%.
- Logistics widget.
- •New widget for presenting data from a logistics template with data associated with DCM.


Fixes/improvements
- (Improvement/Batch) Hiding of buttons etc.
- Option for hiding search field when in real-time
- Option for hidingupdate button when in real-time
- Show search field and button when not in real-time
- (Fix/Dashboard) Navigation Widget
- Fixed navigation font size
- (Fixed/Viewer) Fixed init of realtime
- Instead of fetching the default window size of 15 minutes, data is fetched for an hour
- (Fixed/Auth) Log out if token expired
- The user is logged out if his/her respective token has expired
- Start only the check timer if the user has logged in and remove it again after user logged out
- (Fixed/Value) Fixed: digits: in last value
- There is now an option for determining the number of decimals in last value widget
- (Fixed/Tree) Domain names have been made searchable
- Added: searchability of domain names
- (Fixed/Alarms) Wrong time in Last Triggered
- The "Last Triggered" column would sometimes show 51 years ago, even when the alarm was last triggered 3 months ago, etc.
- (Fixed/Report) Fixed: inputs not changeable
- Widget title font size could not be changed
- Widget subtext could not be changed
- Widget subtext font size could not be changed
- (Improvement/LMM) LinkManager Mobile naming
- LMM naming was changed from “Gatemanagers” to “Domains”
- (Improvement/ Dashboard) Line Chart Widget
- Pressing APPLY will update the layout for all features
- Grid, toolbox and axis lines will follow the font colour
- Margins can be set manually for left, right, top, bottom
- Data sampling is enabled by default in new graphs
- Timespan is only shown for real-time in configuration settings
- Option of adding the title behind the graph
- Combined chart types (line, bar, scatter), with size used for both line and scatter
- Tooltip have been optimised, and charts using the same batch selector have been connected (this is not supported for asynchronous data)
- (Fixed/Dashboard) Editing
- Deleting a widget at the same time as one is editing will cause a crash
Was this article helpful?